NewUptime monitors are liveTry it →
Skip to content
Network · Infrastructure · Security

See every network, server, and threat

Qnetward probes, monitors, and protects your infrastructure from one platform. Diagnostics and uptime monitors today. Agents and attack-surface scans next.

  • Free to start
  • No credit card
  • Self-host ready
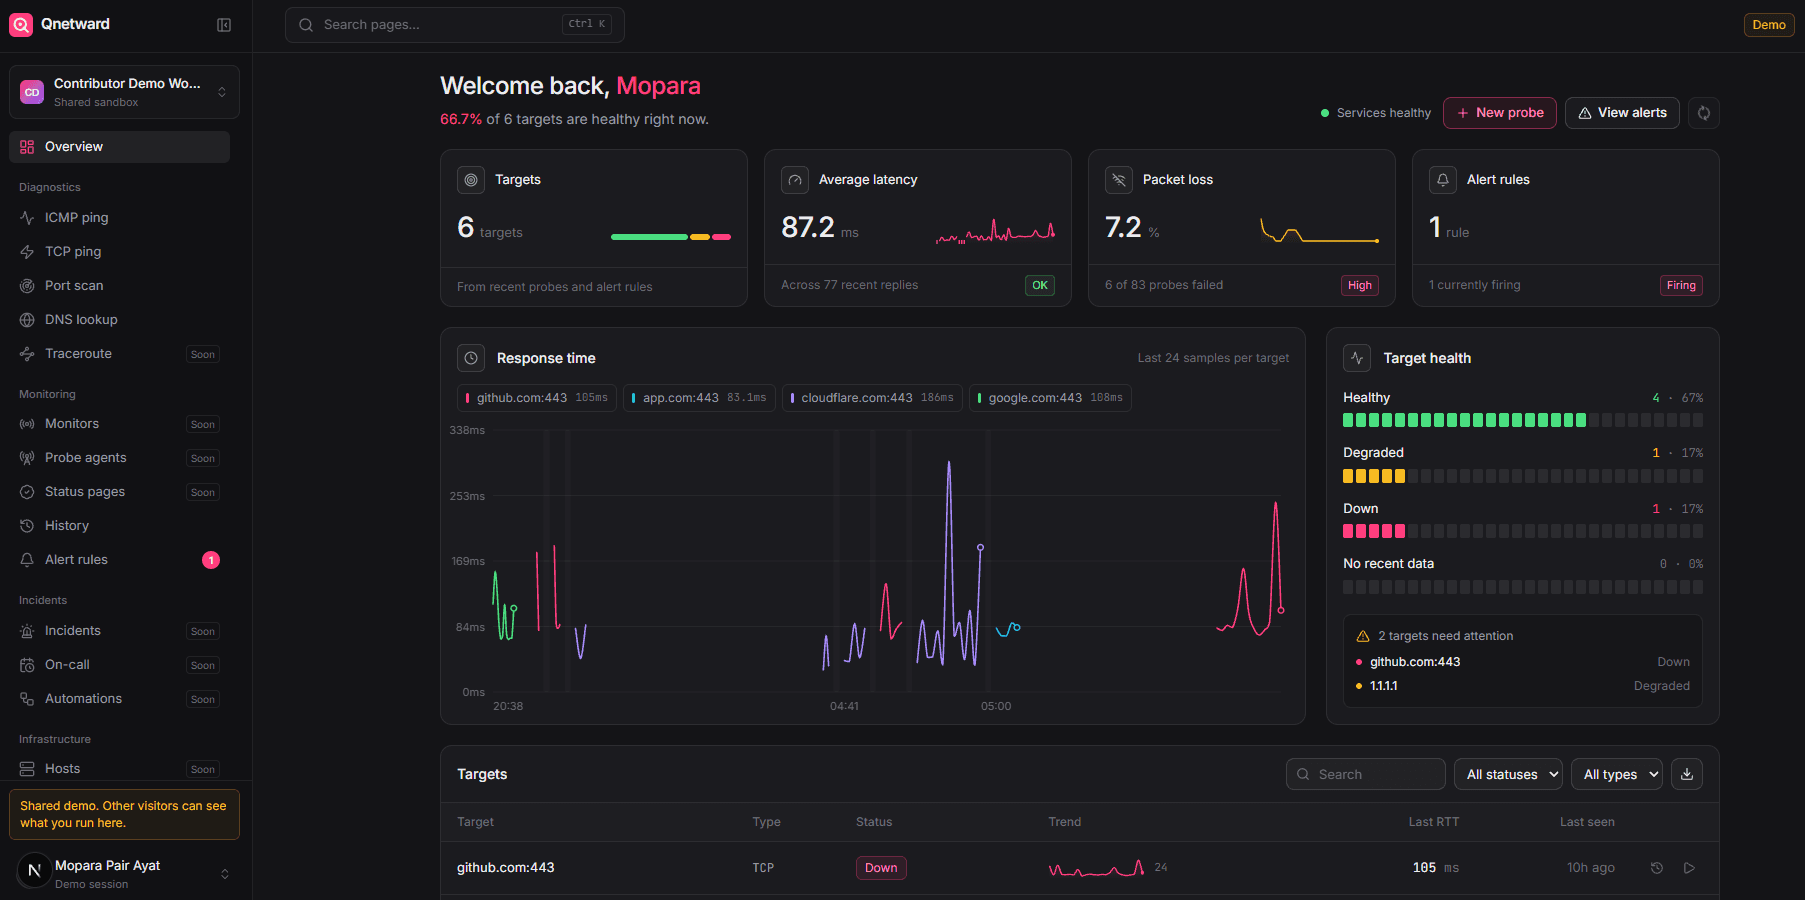
The Qnetward Overview: target count, average latency, packet loss, and alert rules, a response time chart per target, target health, and the targets table.
Runs on today
Integrations in development
Why one tool

Five tabs during an outage is four too many

Most teams stitch diagnostics together from terminal commands, a website or two, and a separate uptime service. Qnetward puts them behind one login, with shared history.
What you use now
In Qnetward
  • ping and mtr in a terminal
    Live ICMP and TCP ping with loss streaks and jitter
  • nmap on someone's laptop
    Port scans saved to history, visible to the team
  • dig, nslookup, and a DNS website
    DNS inspector with DNSSEC and reverse lookups
  • A separate uptime checker
    HTTP(S), TCP, and ping monitors with certificate expiry warnings
  • A spreadsheet of client sites
    One workspace per client, with roles
How it works

Three steps, no install

The console runs every probe from our side, so you can start before you've decided where an agent should live.

Create a workspace
  1. 1

    Create a workspace

    Sign up with an email address. A workspace is created for you, and you can invite teammates now or later.

  2. 2

    Point it at something

    Ping a host, scan its ports, or pull its DNS records. Results stream in as they happen and are kept in history.

  3. 3

    Keep watching what matters

    Turn a URL, port, or host into a monitor checked every minute, even with the tab closed. When it goes down, or a certificate is about to expire, you get an email.

Product

The tools you open during an incident, in one tab

Every screen here is the console as it ships today, captured from the demo workspace.

Replies stream in as they arrive. A live latency chart, loss and jitter as you watch, and a stop button that stops.

TCP ping to cloudflare.com on port 443, running: 13 of 13 replies, average 122 ms, and a live latency chart.
Developers

The console is a client like any other

The same Go engine sits behind the CLI, the REST API, and the WebSocket stream the dashboard uses. If the console can do it, so can your script.

Binary
One static executable for Linux, macOS, and Windows
Output
--json on every command, ready for jq or a pipeline
Control
Start, stream, and cancel a run over one socket
$ qnetward ping -count 4 1.1.1.1
PING 1.1.1.1 (1.1.1.1) 32 bytes
seq=1 time=18.2 ms
seq=2 time=17.9 ms
seq=3 time=19.4 ms
seq=4 time=18.1 ms
4 sent · 4 received · 0% loss · avg 18.4 ms · jitter 0.6 ms
 
$ qnetward portscan -ports 22,80,443,8080 api.acme.dev
443/tcp open 12.1 ms
80/tcp open 11.8 ms
22/tcp filtered
8080/tcp closed
Security

A scanner should refuse to scan what isn't yours

Deeper security scanning is on the way. The guardrails on the right ship first, and no active scan runs against a target until every one of them is in place.

In place today

  • Passwords hashed with bcrypt; sessions, reset tokens, and API keys stored only as hashes
  • Two-factor sign-in with an authenticator app, and an append-only audit log
  • Rate limits on sign-in, verification, and probe endpoints
  • Strict origin checks on the API and live WebSocket
  • Workspace data kept apart by row-level security in the database
  • Probes to private and cloud-metadata addresses blocked by default

Required before any active scan

  • Proof of ownership via DNS TXT record or HTTP token
  • Per-target scope, rate limit, and a kill switch
  • An audit log entry for every scan: who, what, when

How scanning will be gated

Planned · each tier unlocks the next
  1. 0

    Passive

    Any domain

    Public signals only: certificates, DNS records, and HTTP headers. Nothing is sent that a browser wouldn't send.

  2. 1

    Active

    Verified owners

    Port and service discovery, unlocked only after you prove ownership with a DNS TXT record or an HTTP token.

  3. 2

    Deep

    By approval

    Authenticated or intrusive checks. Needs a paid plan, signed consent, and a manual review before the first run.

Network

One vantage point can't tell you whose problem it is

Probing from several regions separates a local blip from a regional outage. We start in Singapore and add regions where customers need them. Primary PlannedRegions shown are planned locations
Pricing

Start free, grow into Pro

Everything that exists today is free, with room for a small team. Pro raises the limits when you need more, paid in taka with bKash, Nagad, Rocket, or card.
Yearly saves BDT 3,000

Free

Everything you need to start monitoring, for you and your team.

BDT 0forever

No card needed

Start free

20
Monitors
25
Members
600 / hr
Probes

Includes

  • ICMP ping, TCP ping, port scan, DNS lookup
  • HTTP(S), TCP, and ping monitors
  • Alerts by email, Slack, Discord, Telegram, or webhook
  • Workspaces, roles, API keys, audit log
  • CSV and JSON export

Pro

Recommended

For teams that rely on Qnetward every day and need room to grow.

BDT 1,250/ month

BDT 15,000 billed yearly

Start with Pro

bKash · Nagad · Rocket · Card

200
Monitors
100
Members
3,000 / hr
Probes

Everything in Free, plus

  • Ten times the monitors
  • Priority email support
  • Probe agents for private networks (planned)
  • Multi-region probing (planned)
  • Longer history retention (planned)

Enterprise

For ISPs, MSPs, and regulated teams with their own requirements.

Custom

Annual agreement, invoiced

Contact sales

2,000
Monitors
1,000
Members
20,000 / hr
Probes

Everything in Pro, plus

  • SSO (SAML, OIDC) and SCIM (planned)
  • Dedicated or self-hosted deployment (planned)
  • Authorized deep security scanning (planned)
  • Audit log export and data residency (planned)
  • Priority support and an SLA (planned)

Works today Planned, not available yetFree needs no card. Pro is paid ahead in taka, with no auto-renewal.

Pay with

Accepted payment methods: bKash, Nagad, Rocket, City Bank, Dutch-Bangla Bank, BRAC Bank, Visa, PayPal, Maestro, American Express, Discover, Mastercard, JCB, UnionPay, and Stripe
Compare plansShow the full table
FeatureFreeProEnterprise
Diagnostics
Ping, TCP ping, port scan, DNS
History retention7 days Planned Planned
Export to CSV and JSON
Monitoring
Alert rules
Chat and webhook alerts
Uptime monitors202002,000
Probe agents and regions Planned Planned
Team and security
Workspaces and roles
SSO and SCIM Planned
FAQ

Common questions

Not covered here? The console is free to explore, so the quickest answer is often to try it.

Do I need to install anything to start?

No. Sign up and run ICMP ping, TCP ping, port scans, and DNS lookups straight from the console. Agents for probing inside private networks are coming next.

Can I scan any host or domain?

Diagnostics like ping and DNS work on any public target. Deeper security scanning will only run on assets you have verified you own, with rate limits and a full audit trail.

Can my whole team use one account?

Yes. Create a workspace, invite teammates by email, and give each person a role: owner, admin, or member. You can belong to several workspaces and switch between them.

Where is my data stored?

Results live in PostgreSQL with TimescaleDB in our primary region, Singapore. Per-region data residency is on the roadmap before we onboard customers who need it.

Can I self-host Qnetward?

The stack ships as Docker Compose today (API, dashboard, TimescaleDB, Redis, S3-compatible storage). A supported self-hosted edition is planned for enterprise teams.

How do I get alerted?

Add a monitor and you get an email when it goes down, when it comes back, and two weeks before an HTTPS certificate expires. Alert rules add latency and loss thresholds on top. Slack, Telegram, Discord, and webhooks are next.

Start watching your network

Free to start, no card required. Your first probe runs in under a minute, and your monitors keep checking after you close the tab.
